What Are Heat Maps and How to Use Them
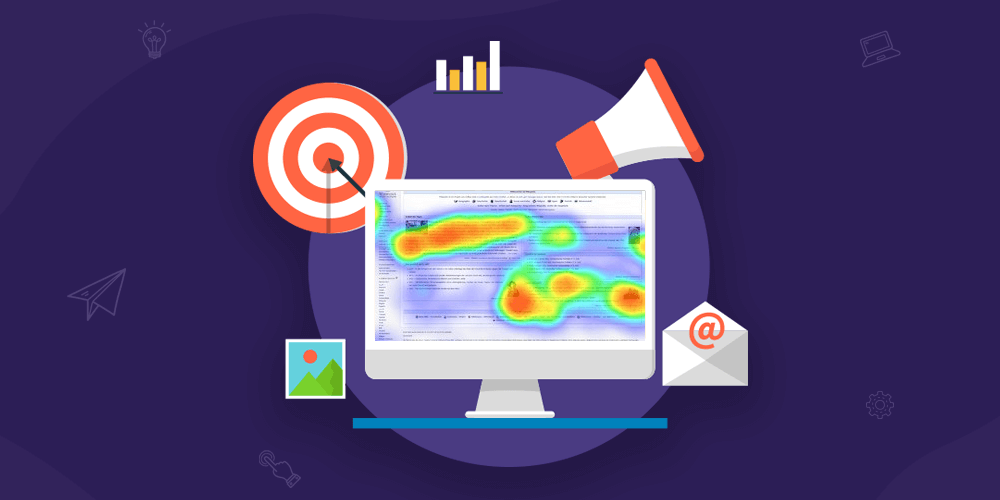
Knowing first-hand how your website users behave is a key factor in improving various aspects of your website such as conversions or the usability and user experience (UX). If you're wondering how to find out, the answer is simple: using a web heatmap.
Having tools or data that allow you to analyse your website in order to improve it’s priceless. Obviously, in a physical business you’d know exactly where customers go first, if they stop to look at the shop window or if they look at promotions inside the store.
However, everything’s completely different on a website. In fact, without using a proper tool you wouldn't know where users click, where they spend most of their time or which sections or parts of it are (almost) invisible. And this is where heatmaps come into play.
What are heat maps? Definition
According to Optimizely, a heatmap is:
A graphical representation of data that uses a system of color-coding to represent different values.
Colour scale on a heat map

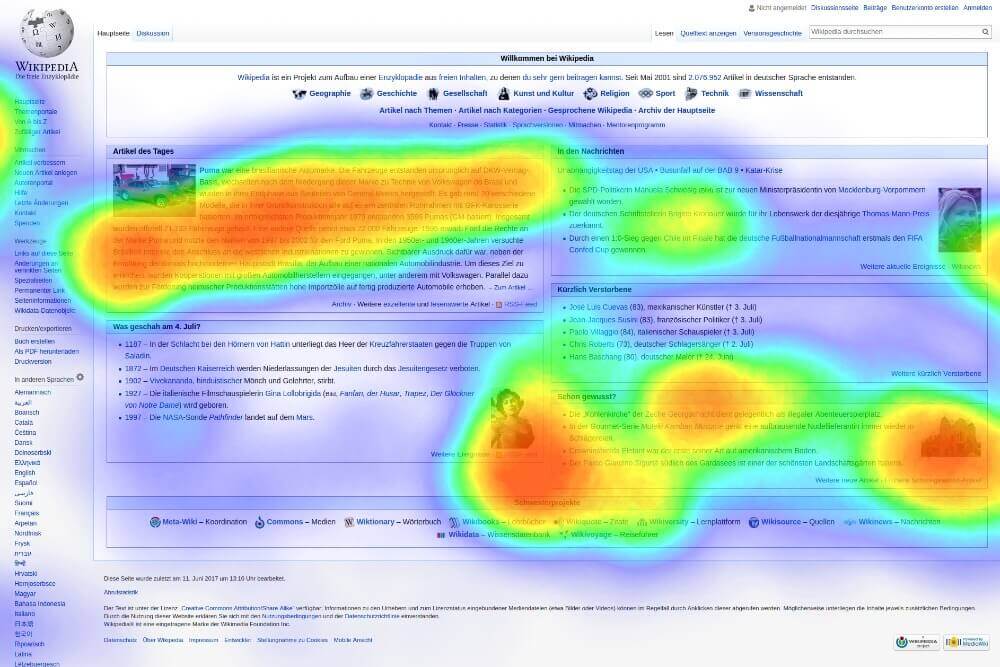
Heatmaps are used in various forms of analytics but are most commonly used to show user behaviour on specific webpages or webpage templates. The colours used indicate the intensity of visitor engagement on different sections of a page.
Website heatmaps use a warm-to-cold colour scheme to show a web page’s performance, with the warmest colours (red, orange, yellow) indicating the highest visitor engagement and the coolest (blue, green, turquoise) indicating the lowest visitor engagement.
BONUS: no colours means no interaction.
Types of website heat maps
Heatmaps can be used to show where users have clicked on a page, how far they have scrolled down a page, or used to display the results of eye-tracking tests. Let’s discover the main types of heat maps.
1. Scroll maps
Scroll maps show the exact percentage of people that scroll down to any point on the webpage. The redder the area, the more visitors saw it.
2. Move maps
Move maps track where users move and pause their mouse (‘hot’ spots) when navigating the site. Research suggests a correlation between where people look and where the mouse is.
3. Click maps
Click maps show an aggregate of where visitors click their mouse on desktop devices and tap their finger on mobile devices. The map is colour-coded to show the elements that have been clicked and tapped the most.
5 advantages of using heat maps
The benefits of using heat maps on a website are pretty clear.
1. Where to place ads
Heat maps help analyse a website's visibility, so if you want to increase the revenue coming in from advertising or affiliate program referrals, you should choose the best place on the web.
2. Analyze web conversions
Heat maps are used to find out if there are errors on the web or in the purchasing process that make it difficult to get a conversion.
3. Detecting design flaws
Heat maps are used to identify where the cursor spends the most time or where users don’t move the mouse. This is useful for identifying the best areas on the web in order to locate conversion items (free trial button, newsletter subscription, contact form, etc.)
4. Perform A/B test
With an A/B test you can make changes to the design, colours or text of the website without affecting it. In other words, users will arrive at option A or B and you’ll be able to check which one is more effective.
5. Get feedback on the interface
Heat maps help to identify the satisfaction level of the interface and whether it fulfils the purpose for which it was designed, which is tremendously useful on pages with unusual layouts.
3 best heat mapping tools
Although there are quite a few alternatives to install a heat map on a website, here are the best on the market.
1. Hotjar
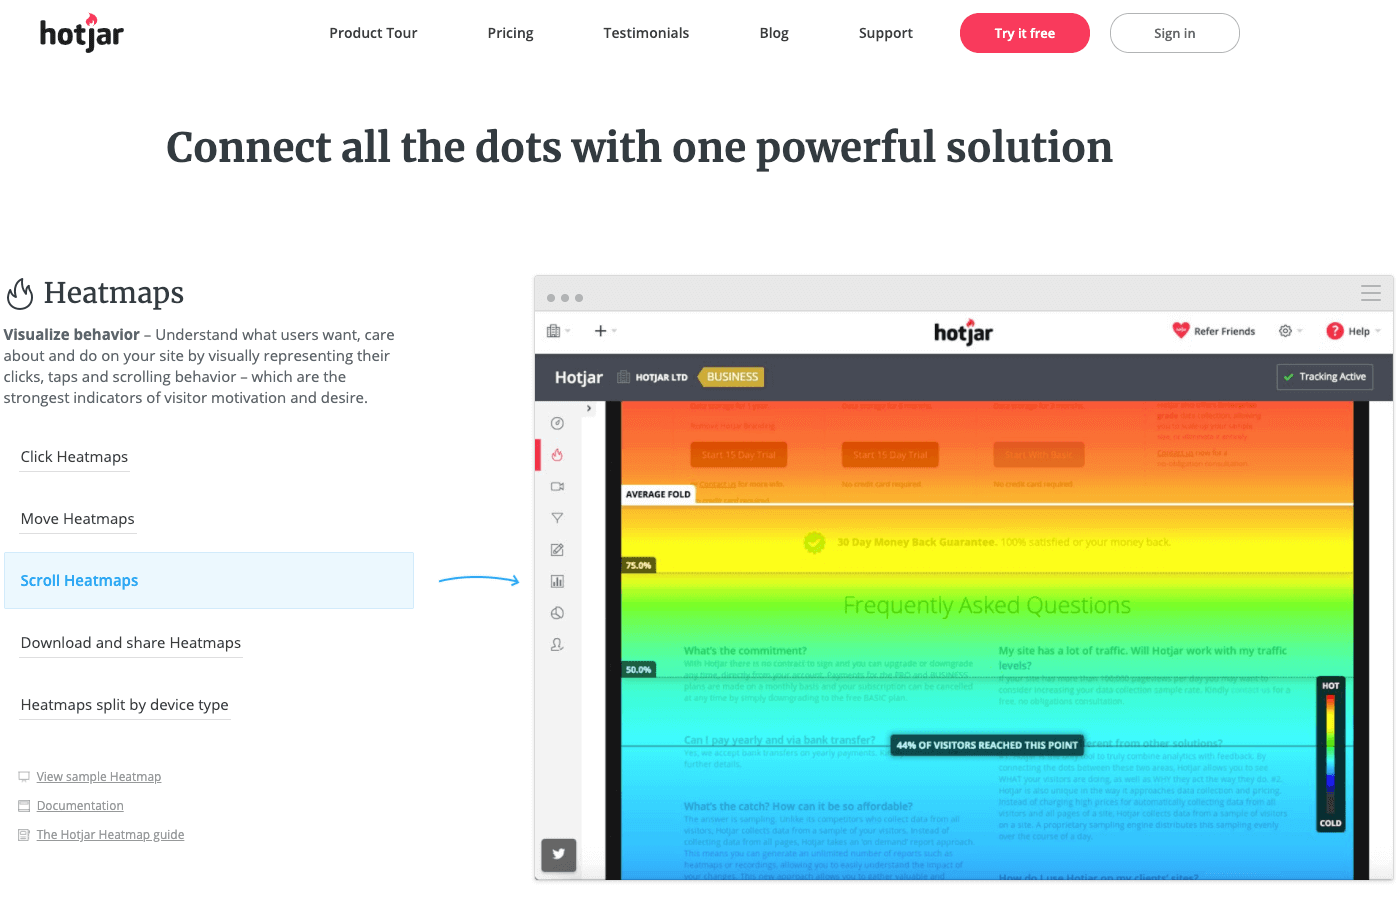
Hotjar is the online heat mapping tool par excellence. In fact, its free version records the interactions of up to 2,000 visitors per day and saves the data for a year. There are also paid packages ranging from €29 to €989 per month.
2. Crazy Egg
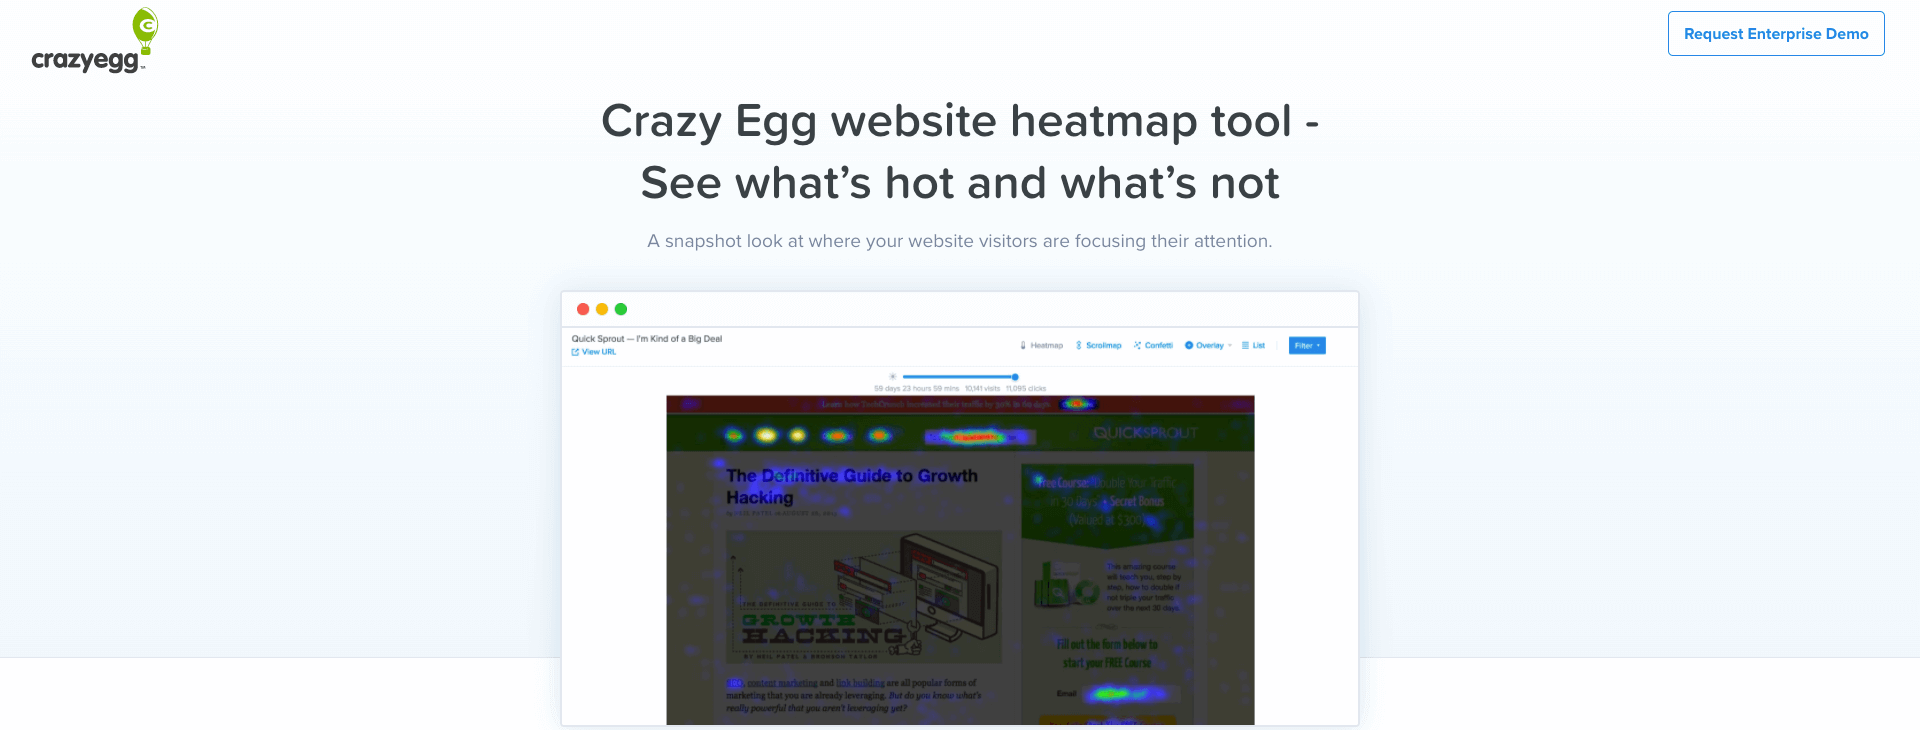
Crazy Egg is one of the most popular heat mapping tools, although it isn’t free. However, there is a free 30-day trial period. It stands out above all because it’s intuitive and easy to use, not to mention its infinite options. As a curiosity, one of the world's top SEO experts, Neil Patel, is one of its founders.
3. Yandex.Metrica
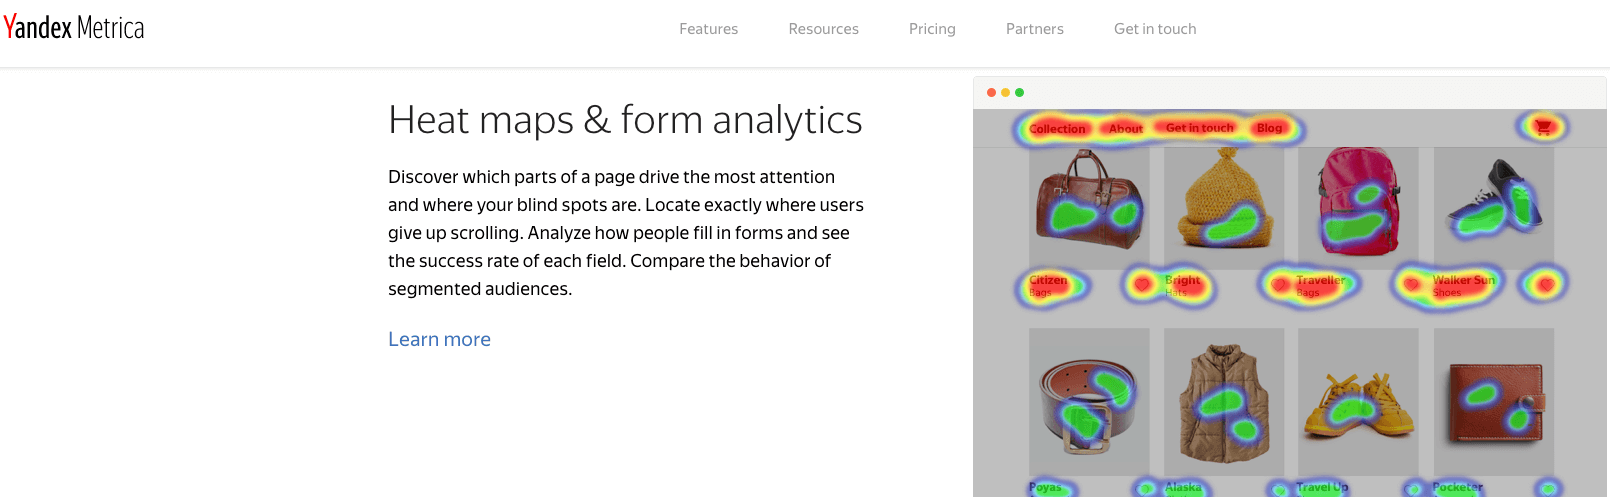
Yandex.Metrica is the most attractive option on the market in terms of price. The reason? It's 100% free. It's a great alternative to Google Analytics, since it also offers data about a website's traffic, audience, performance, user behaviour, etc.
In short, with web heat maps you can easily know which parts of your site attract users the most, which parts attract users the least, and act accordingly to improve conversions.

![Mejores agencias de desarrollo web en Chile [2025]](/cms/uploads/mejores_agencias_desarrollo_web_chile_2025-1200-swxn0q.png)